

Step 1: Setting parameters for simulation
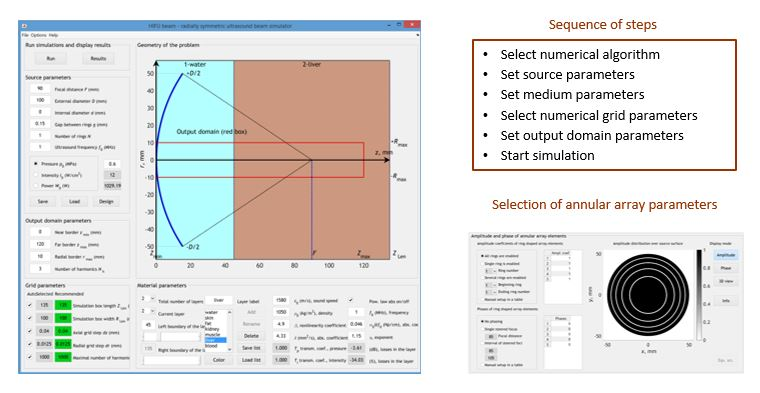
Step 2: View the results at a given point
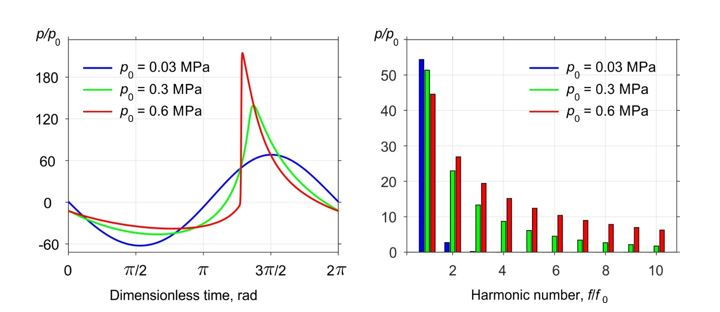
Nonlinear-diffraction waveform distortion, generation of higher harmonics and shock formation at the focus at increasing source pressure p0.
Step 3: View one-dimensional distributions
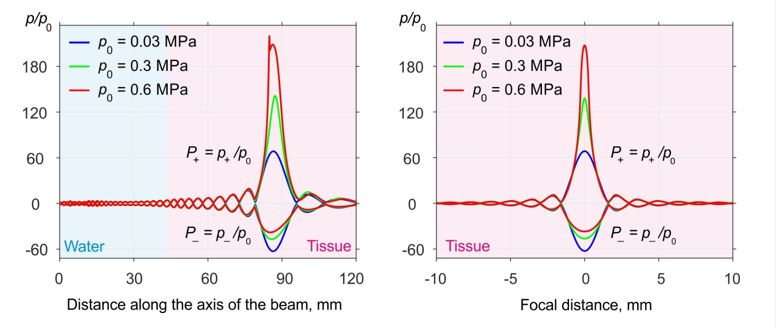
Distributions of peak pressures P+ and P-, intensity I, heat sources Q, harmonics amplitudes An and phases ϕn along the beam axis (z) and across the axis in the focal plane (x) can be displayed and stored
Step 4: View two-dimensional distributions
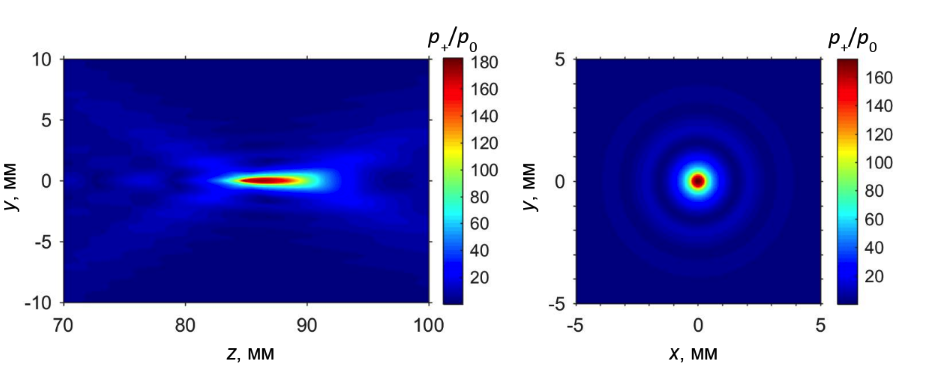
Two-dimensional distributions of peak pressures P+ and P-, intensity I, heat sources Q, harmonics amplitudes An and phases ϕn in the axial plane of the beam and in the focal plane can be displayed and stored